Simple tutorial using default bayesian method on example file
If not already done, download the archive containing the reference
databases and the bayesian models from zenodo.org, using
the inborutils package. You can change the
path option to where you want to download the archive
(default is current directory ‘.’):
remotes::install_github("inbo/inborutils")
inborutils::download_zenodo("10.5281/zenodo.13733183", path=".")
Store the path to the archive containing the reference databases and the bayesian models:
refdata_archive_path = "path/to/genomesizeRdata_v1.0.3.tar.gz"Read the example input file from the package. This example data is a subset of the dataset from Labouyrie et al. 2023:
example_input_file = system.file("extdata", "example_input.csv", package = "genomesizeR")Load the package:
library(genomesizeR)Run the main function to get the estimated genome sizes (with the default method which is the bayesian method):
results = estimate_genome_size(example_input_file, refdata_archive_path,
                               sep='\t', match_column='TAXID', output_format='input',
                               ci_threshold = 0.5)

  #############################################################################
  # Genome size estimation summary:
  #
  #  50.55556 % estimations achieving required precision
  #
       Min.   1st Qu.    Median      Mean   3rd Qu.      Max.
    2973116   5404298  17307947  23865759  41709153 140613929

  # Estimation status:
  Confidence interval to estimated size ratio > ci_threshold   OK
                                                          89   91
Plot genome size histogram per sample
Then, the results can be visualized using the plotting functions provided. This histogram shows the estimated genome sizes for each sample.
plotted_df = plot_genome_size_histogram(results)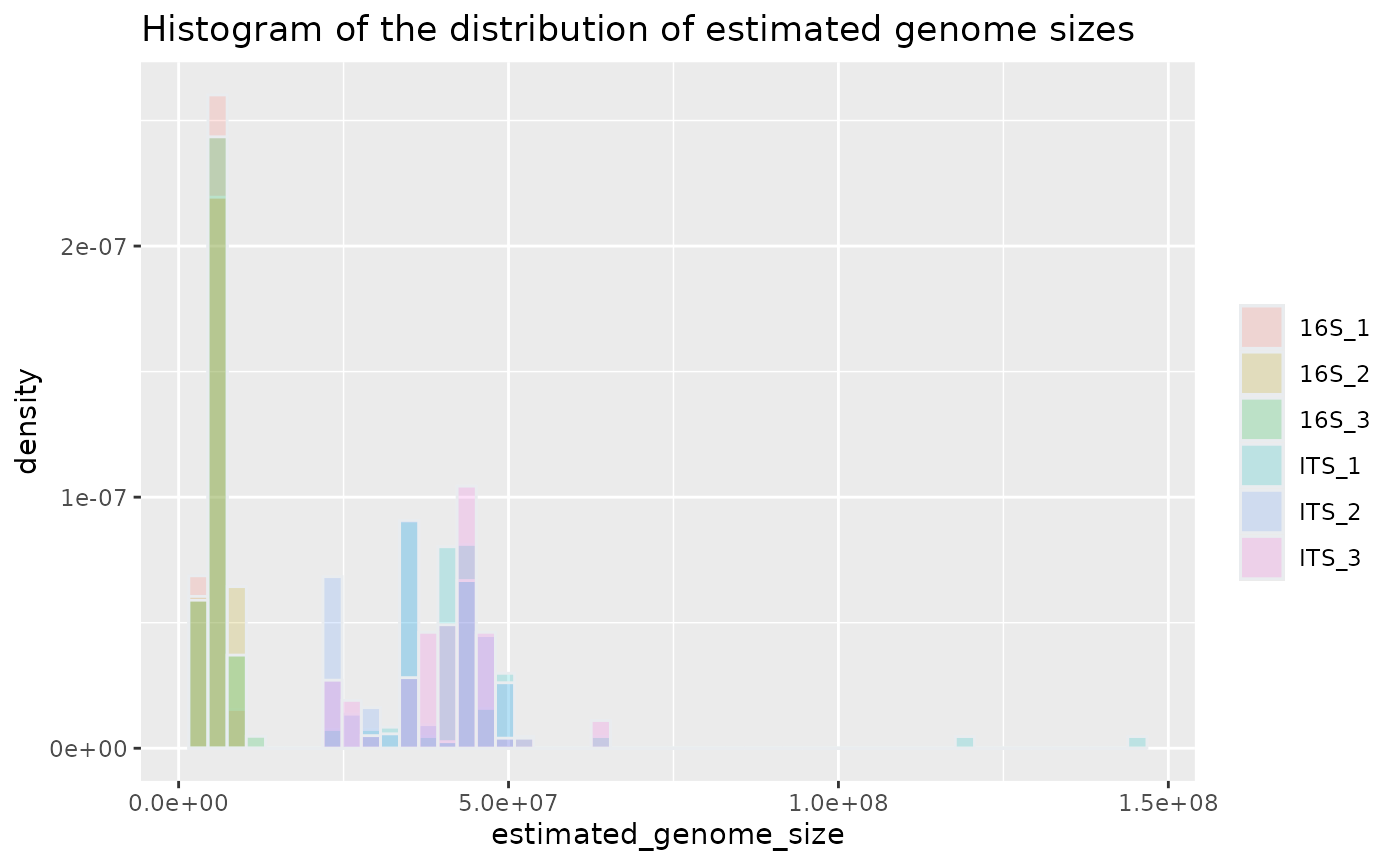
Plot genome size histogram for one sample
plotted_df = plot_genome_size_histogram(results, only_sample='16S_1')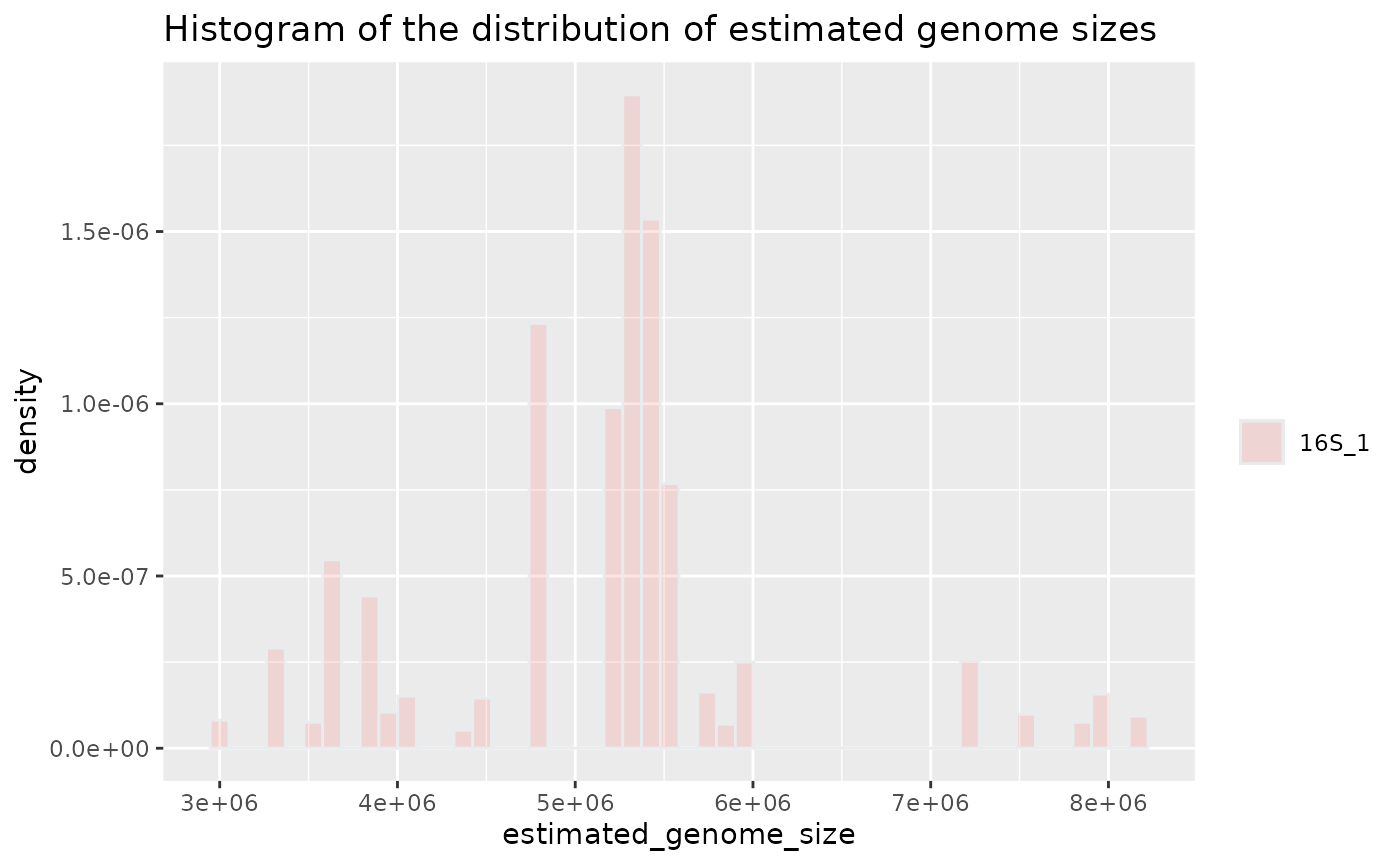
Plot genome size boxplot per sample
This boxplot shows the estimated genome sizes for each sample:
plotted_df = plot_genome_size_boxplot(results)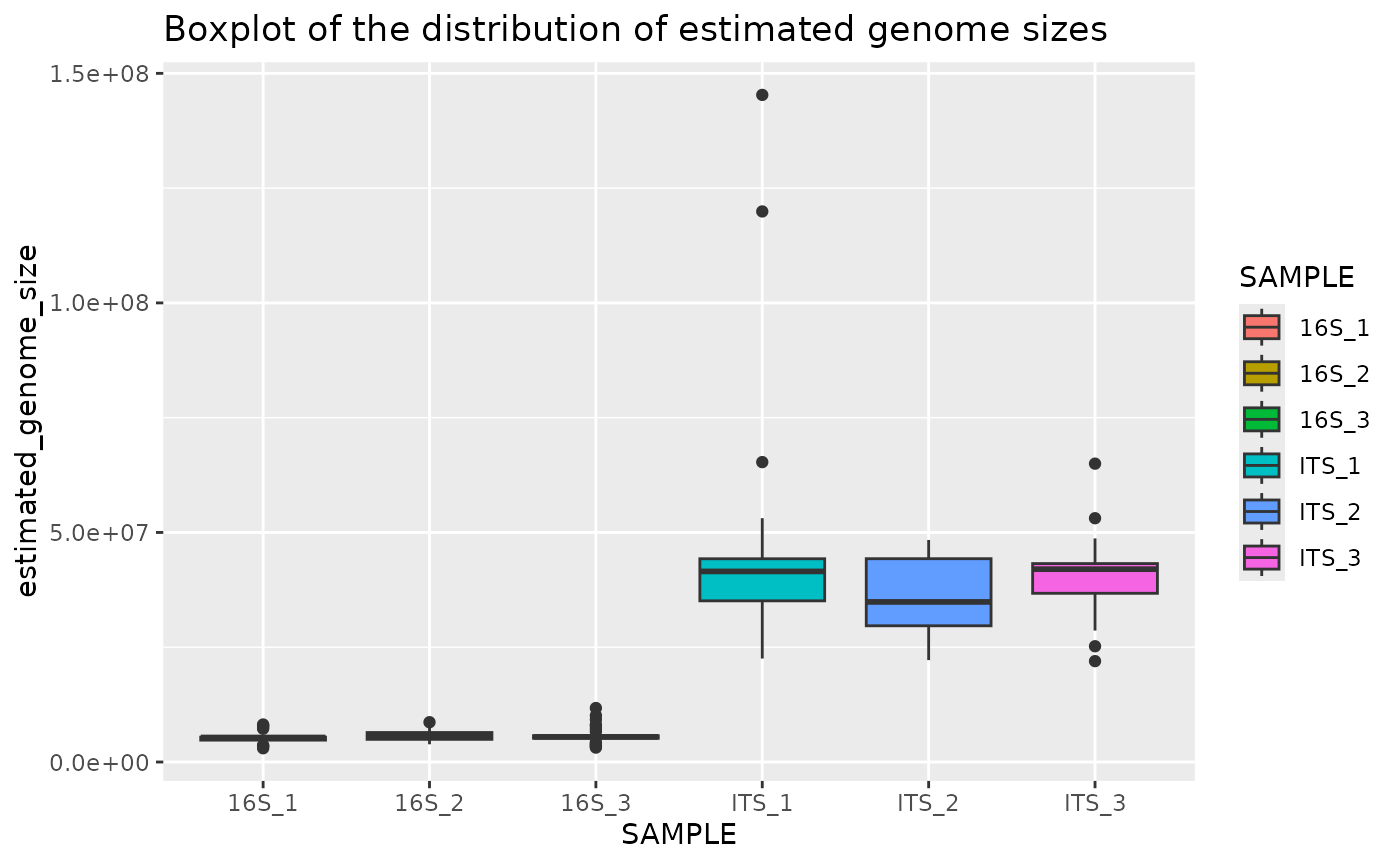
Plot genome size boxplot for one sample
plotted_df = plot_genome_size_boxplot(results, only_sample='ITS_1')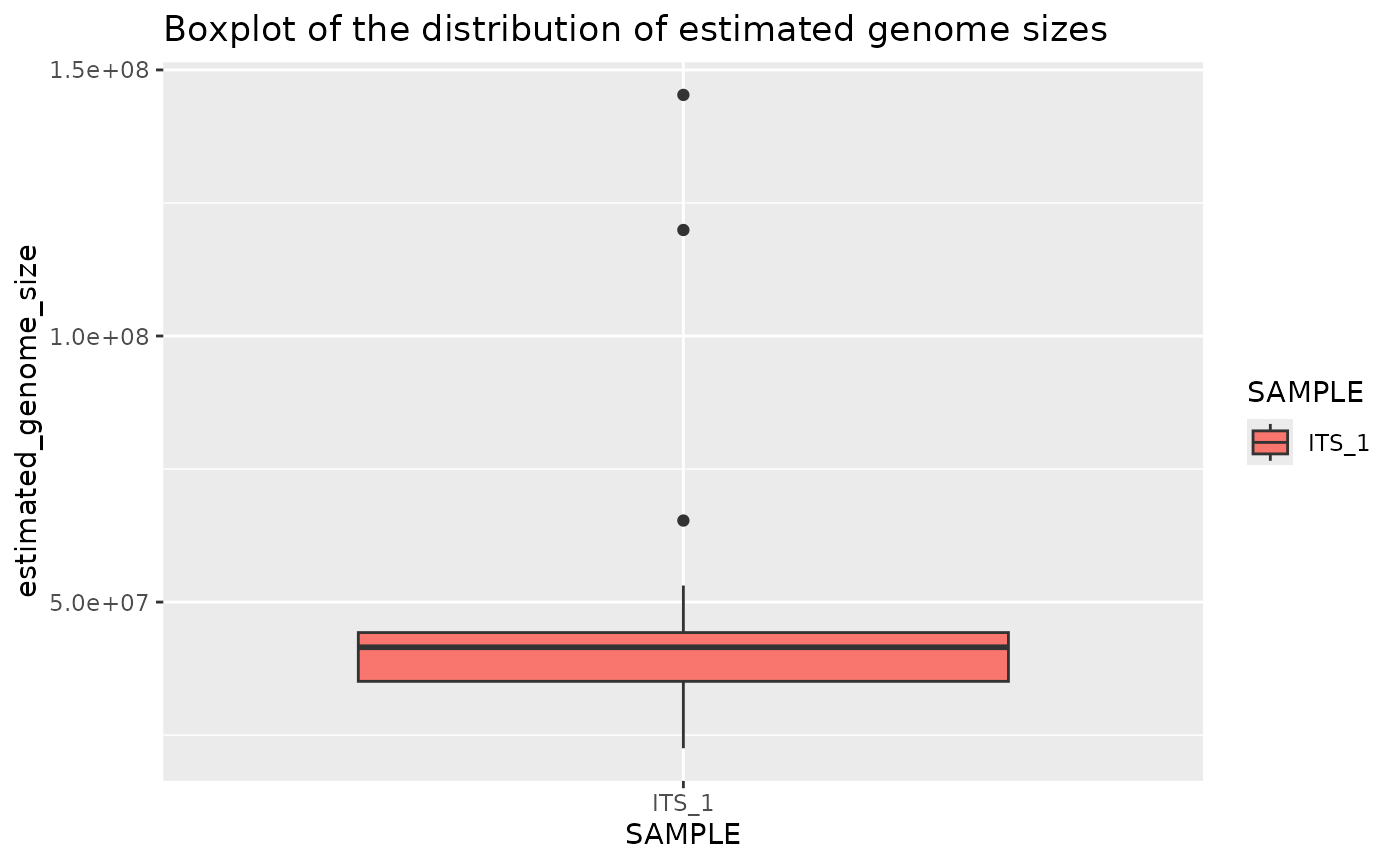
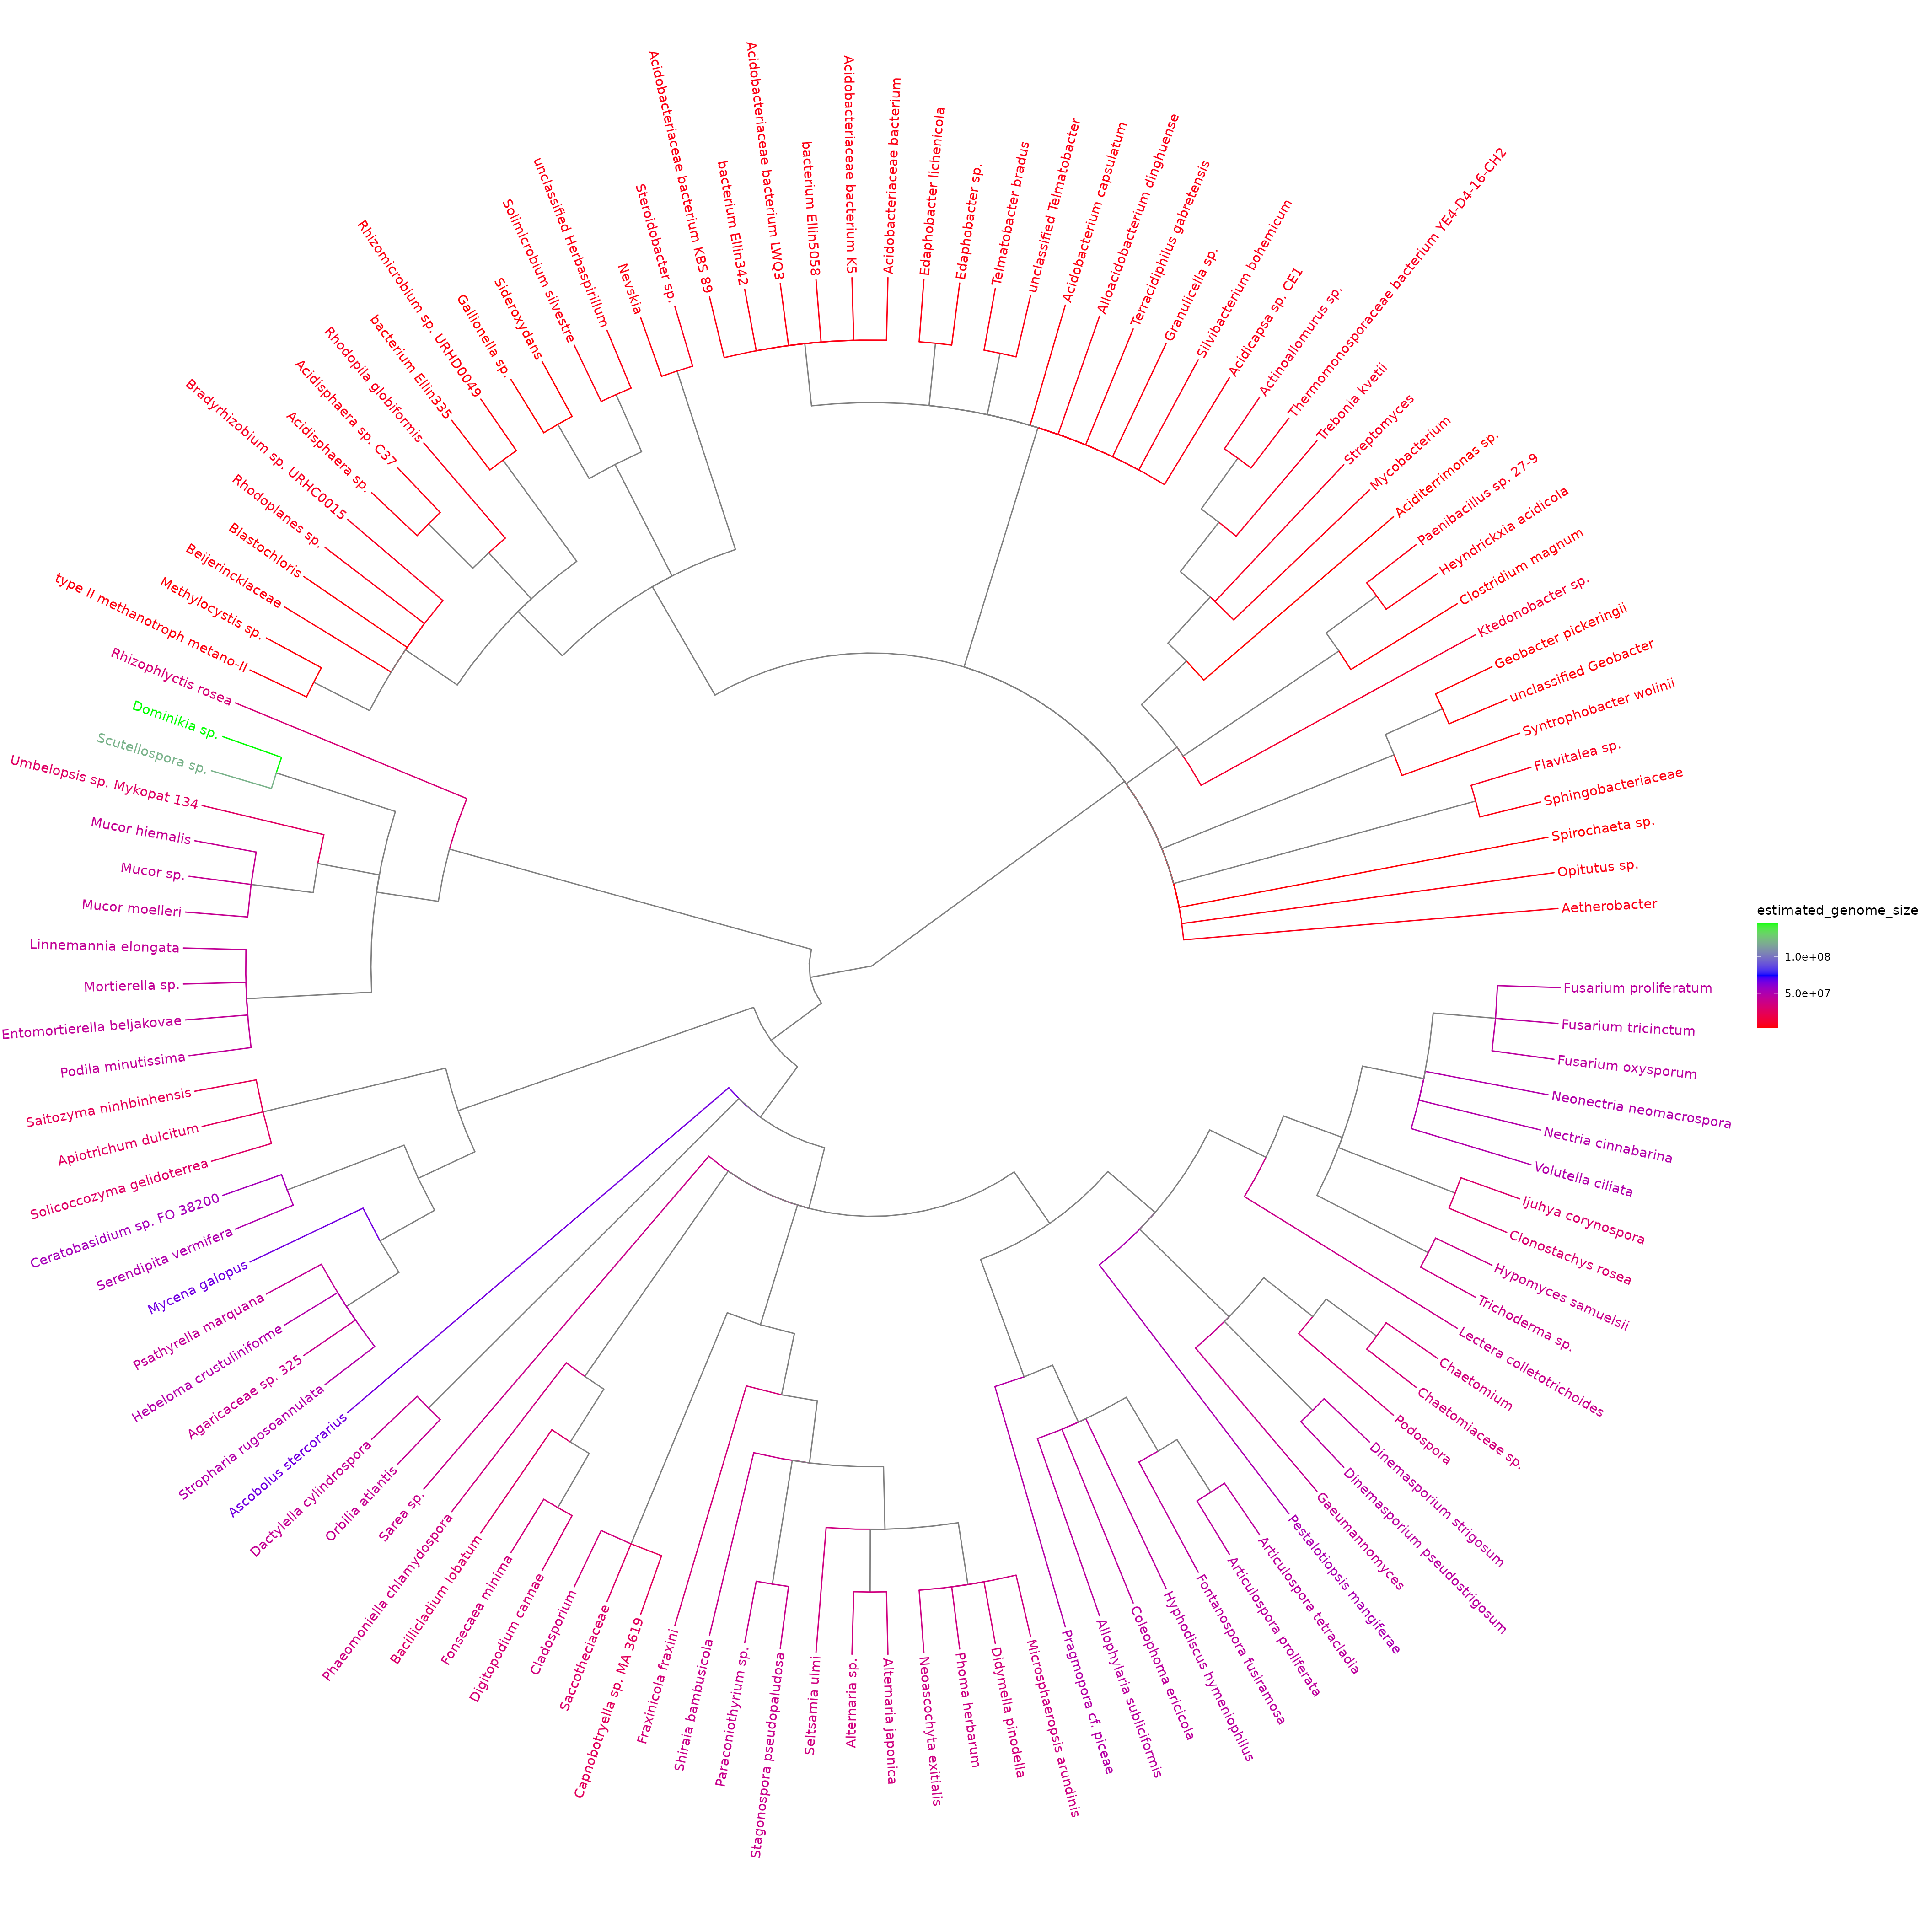
Plot simplified taxonomic tree with colour-coded estimated genome sizes
This tree shows the taxonomic relationships as well as the estimated genome sizes. The difference between the genome size distribution of bacteria (16S marker) and fungi (ITS marker) is visible.
plotted_df = plot_genome_size_tree(results, refdata_archive_path)## Untarring reference data
## Using reference data in: /tmp/RtmpZY6Wjc/refdata
## Untarring taxonomy
## Using taxonomy: /tmp/RtmpZY6Wjc/taxdump